India Market Wrap: Nifty Drops to 24,187 (-0.21%) — Banking Drag Counters FII Inflows
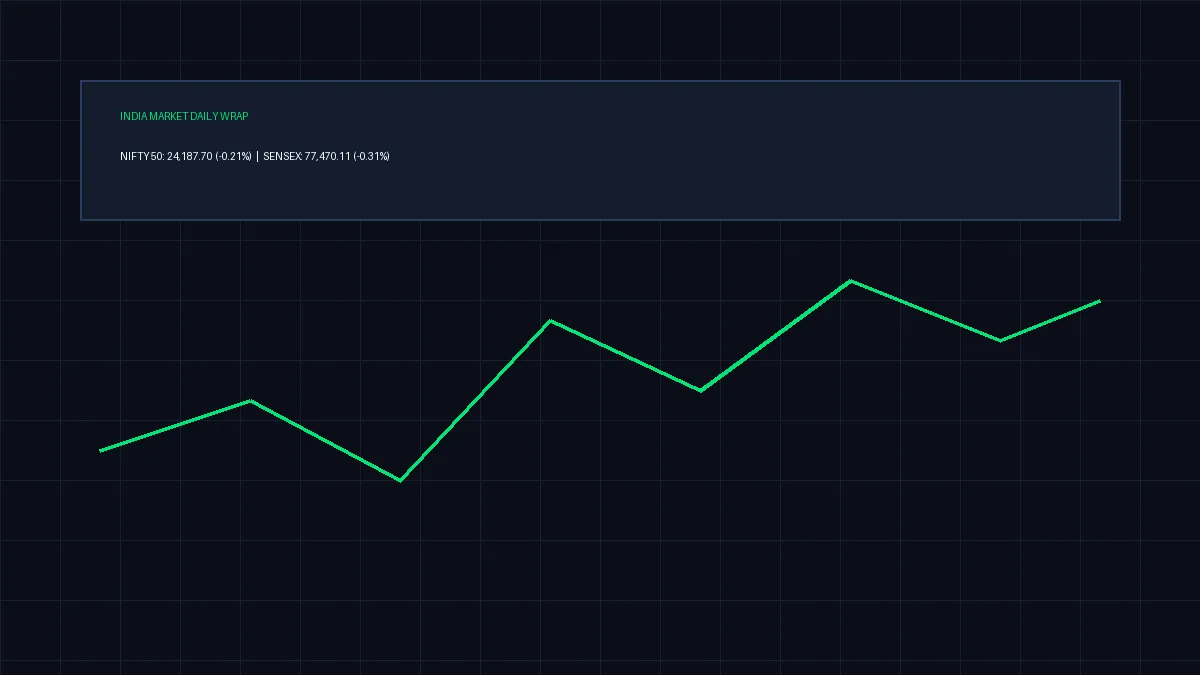
India Market Wrap: Nifty Drops to 24,187 (-0.21%) — Banking Drag Counters FII Inflows
Indian benchmark equity indices ended marginally lower on Tuesday, July 21, 2026, as persistent selling pressure in banking and financial heavyweights offset robust institutional buying from Foreign Institutional Investors (FIIs). The NSE Nifty 50 slipped below the key psychological threshold of 24,200 to settle at 24,187.70, while the BSE Sensex shed 238.41 points amid elevated crude oil prices and cautious corporate earnings commentary.
Despite headline indices finishing in the red, broader market breadth remained decisively positive. Midcap and smallcap counters extended their outperformance streak as retail and high-net-worth investors accumulated shares across real estate, automotive, and healthcare sectors.
This comprehensive technical market intelligence briefing analyzes the core liquidity, derivative positioning, and macroeconomic forces shaping Dalal Street: the banking sector's net interest margin (NIM) compression and loan-to-deposit ratio (LDR) rebalancing, the divergent institutional flow dynamics between FII buying (+₹1,650.16 Cr) and DII profit booking (-₹656.88 Cr), the macroeconomic impact of Brent crude touching $85/bbl on India's current account deficit, and the multi-timeframe technical support levels across Nifty 50 and Bank Nifty.
📊 1. Macro-Market Overview & Benchmark Metrics
                      [Dalal Street Intraday Liquidity & Sectoral Flow Architecture]
                                                │
                                                ▼
                      [Macro Opening: Elevated Brent Crude ($85/bbl) & US 10-Yr Yields (4.28%)]
                                                │
          ┌─────────────────────────────────────┴─────────────────────────────────────┐
          ▼                                                                           ▼
[Headline Large-Cap Pressure: Financials & IT]                  [Broader Market Alpha: Midcap & Smallcap Accumulation]
• HDFC Bank (-2.1%) & ICICI Bank (-0.8%) Drag Index Heavyweight • Nifty Midcap 100 (+0.33%) & Smallcap 100 (+0.48%) Extend Gains
• IT Services Face Discretionary Tech Budget Delays in US/EU    • Nifty Realty Surges +1.42% on Q1 Residential Pre-Sales
• Nifty 50 Sinks to Intraday Low of 24,142 Before Rebounding    • Market Breadth Positive: 1,480 Advances vs. 1,120 Declines
          │                                                                           │
          └─────────────────────────────────────┬─────────────────────────────────────┘
                                                │
                                                ▼
                      [FIIs Net Buy +₹1,650.16 Cr; DIIs Book Profits (-₹656.88 Cr) into End-of-Day Close]
Comprehensive Closing Performance Matrix (July 21, 2026):
| Benchmark / Sectoral Index | Closing Level | Absolute Change | Percentage Change (%) | 52-Week High / Low Range | P/E Ratio (TTM) |
|---|---|---|---|---|---|
| BSE Sensex | 77,470.11 | -238.41 | -0.31% | 78,150.20 / 64,830.15 | 23.4x |
| NSE Nifty 50 | 24,187.70 | -50.80 | -0.21% | 24,420.50 / 19,650.40 | 22.1x |
| Nifty Bank | 52,140.35 | -315.60 | -0.60% | 53,200.00 / 43,800.25 | 16.2x |
| Nifty Financial Services | 23,410.80 | -136.50 | -0.58% | 23,890.00 / 19,450.00 | 17.8x |
| Nifty Midcap 100 | 56,820.40 | +185.10 | +0.33% | 57,150.00 / 38,200.00 | 29.8x |
| Nifty Smallcap 100 | 18,410.25 | +88.50 | +0.48% | 18,650.00 / 12,100.00 | 28.4x |
| Nifty Realty | 1,085.60 | +15.20 | +1.42% | 1,110.00 / 580.00 | 44.5x |
| Nifty Auto | 25,640.20 | +216.40 | +0.85% | 25,900.00 / 15,200.00 | 26.2x |
| Nifty IT | 38,750.10 | -305.20 | -0.78% | 40,200.00 / 28,600.00 | 31.0x |
| Nifty PSU Bank | 7,120.40 | -82.90 | -1.15% | 7,450.00 / 4,950.00 | 8.8x |
🏦 2. Banking Sector Anatomy: Why Financials Dragged the Market
Net Interest Margin (NIM) Compression, Deposit Cost Re-Pricing, and Loan-to-Deposit Ratio (LDR) Targets
The Structural Squeeze in Private and Public Lenders: The primary headwind holding back benchmark indices was the banking cluster, which commands over 33% weighting in the Nifty 50. Following recent Q1 FY27 earnings disclosures, management commentary from private sector heavyweights highlighted persistent pressures:
- High Cost of Funds & Deposit Re-Pricing: Even as the Reserve Bank of India maintained the policy repo rate at 6.50%, banks have had to aggressively bid for retail term deposits (offering 7.25%–7.75%) to fund double-digit credit growth. This lagged deposit re-pricing compressed net interest margins by 12 to 18 basis points across major lenders.
- Elevated Loan-to-Deposit Ratios (LDR): Heavyweights like HDFC Bank (operating with an elevated post-merger LDR near 102%) continue to prioritize deposit accretion over aggressive credit expansion, dampening near-term net interest income (NII) growth trajectories.
- Credit Cost Normalization in Unsecured Portfolios: Both private and PSU banks reported early signs of rising slippages in unsecured personal loans and credit cards, prompting analysts to factor in higher provisioning costs over the next 2 to 3 quarters.
                      [Indian Banking Sector Margin & Liquidity Dynamics]
                                                │
                                                ▼
                      [RBI Repo Rate Unchanged at 6.50% $\to$ High Terminal Deposit Rates (7.50%)]
                                                │
          ┌─────────────────────────────────────┴─────────────────────────────────────┐
          ▼                                                                           ▼
[Liability Side: Deposit Accretion Pressure]                    [Asset Side: Credit Growth Constraints]
• Bank Deposits Growing at 11.8% YoY vs. Credit at 14.5% YoY   • Lenders Forced to Slow Unsecured Loan Origination
• Term Deposit Re-Pricing Squeezes Blended Cost of Funds       • Loan-to-Deposit Ratio (LDR) Rebalancing Curbs Asset Expansion
• Private Banks Lose 15 bps in Net Interest Margins (NIM)      • Modest 8-10% NII Growth Projected for Q1-Q2 FY27
          │                                                                           │
          └─────────────────────────────────────┬─────────────────────────────────────┘
                                                │
                                                ▼
                      [Short-Term Banking Valuation Derating While Asset Quality Remains Healthy]
Comparative Financial Metrics: Key Banking Heavyweights (Q1 FY27 Estimates):
| Bank Name | Current Price (₹) | Intraday Change | Net Interest Margin (NIM) | GNPA Ratio (%) | Loan-to-Deposit Ratio (LDR) |
|---|---|---|---|---|---|
| HDFC Bank | ₹1,612.40 | -2.05% | 3.42% (-14 bps YoY) | 1.24% | 101.8% (Targeting <90%) |
| ICICI Bank | ₹1,188.50 | -0.82% | 4.36% (-10 bps YoY) | 2.16% | 85.4% (Optimal) |
| State Bank of India (SBI) | ₹842.10 | -1.22% | 3.22% (-18 bps YoY) | 2.21% | 74.2% (Comfortable) |
| Axis Bank | ₹1,245.00 | -0.45% | 3.98% (-12 bps YoY) | 1.42% | 89.2% |
| Kotak Mahindra Bank | ₹1,780.20 | +0.15% | 5.02% (-8 bps YoY) | 1.38% | 84.1% |
🛢️ 3. Macro Headwinds: Crude Surge vs. FII Liquidity Dynamics
Geopolitical Risk Premium in Brent Crude ($85/bbl), CAD Sensitivity, and Institutional Divergence
The Economic Interplay Between Oil Inflation and Foreign Capital Inflows: Global macro cues presented a contrasting backdrop for Indian equities. Escalating geopolitical tensions in the Middle East pushed international benchmark Brent crude futures up by 1.8% to $85.40 per barrel.
- Macro Inflation & Current Account Deficit (CAD): As India imports over 85% of its crude oil requirements, every sustained $10/barrel surge in crude prices expands the nation's annual import bill by approximately $13.5 billion, widens the trade deficit by 45 basis points of GDP, and creates depreciation pressure on the Indian Rupee (INR currently trading at 83.54/USD).
- FII Net Buying Surge (+₹1,650.16 Cr): Despite oil headwinds, Foreign Institutional Investors emerged as aggressive net buyers in the cash segment, injecting ₹1,650.16 crore. Global emerging market funds rebalanced allocations toward India due to robust macroeconomic stability (projected 7.0% FY27 GDP growth) and softening US Treasury yields (10-year yield declining to 4.28%).
- DII Profit Booking (-₹656.88 Cr): Domestic Institutional Investors took advantage of morning liquidity to lock in gains, recording a net outflow of ₹656.88 crore across large-cap IT and PSU banking stocks following recent market highs.
Institutional Investment Flow Breakdown (July 2026 Month-to-Date):
| Trading Date | FII Cash Inflow / Outflow (₹ Cr) | DII Cash Inflow / Outflow (₹ Cr) | Net Institutional Flow (₹ Cr) | Nifty 50 Daily Trend |
|---|---|---|---|---|
| July 21, 2026 | +₹1,650.16 | -₹656.88 | +₹993.28 | Slipped -0.21% (Consolidation) |
| July 20, 2026 | +₹842.50 | +₹1,210.40 | +₹2,052.90 | Gained +0.38% |
| July 17, 2026 | -₹1,240.20 | +₹1,850.10 | +₹609.90 | Flat (+0.05%) |
| July 16, 2026 | +₹2,105.80 | -₹420.50 | +₹1,685.30 | Gained +0.62% |
| July 15, 2026 | +₹1,450.00 | +₹980.20 | +₹2,430.20 | Gained +0.44% |
| July MTD Total | +₹14,820.40 Cr | +₹18,450.20 Cr | +₹33,270.60 Cr | Bullish Institutional Bias |
📈 4. Technical Analysis & Derivative Market Structure
Multi-Timeframe Fibonacci Levels, Exponential Moving Averages, and Option Open Interest (OI)
Nifty 50 Chart Analysis: From a technical charting perspective, the Nifty 50’s pullback to 24,187 represents a textbook consolidation test of the 20-day Exponential Moving Average (EMA) located at 24,140. The index remains within a well-defined ascending channel initiated from the June 2026 swing low (23,300).
                      [Nifty 50 Key Technical Support & Resistance Blueprint]
                                                │
                                                ▼
                                   [Resistance 2: 24,420 (All-Time High)]
                                                │
                                   [Resistance 1: 24,300 - 24,350 (Call Wall)]
                                                │
 ═════════════════════════════════ [Current Nifty Close: 24,187.70] ═════════════════════════════════
                                                │
                                   [Immediate Support 1: 24,140 (20-Day EMA)]
                                                │
                                   [Critical Base 2: 23,950 - 24,000 (Put Wall & 50-Day EMA)]
- Derivative Open Interest Concentration: On the NSE derivatives front, the highest Call open interest is densely clustered at the 24,500 Strike (1.28 Cr shares) followed by 24,300 Strike (94 Lakh shares), creating a firm overhead resistance band. On the downside, the maximum Put open interest is positioned at the 24,000 Strike (1.42 Cr shares), establishing a formidable psychological and institutional cushion.
- Put-Call Ratio (PCR): The Nifty 50 derivative Put-Call Ratio settled at 0.88, indicating that call writers hold a mild short-term advantage while the market remains far from oversold territory (which typically triggers below 0.65).
- India VIX: India VIX rose by 1.8% to 14.42, signaling a moderate uptick in intraday option premiums ahead of major corporate earnings announcements and monthly derivatives expiry.
Key Pivot Levels for Tomorrow's Trading Session:
| Index | Pivot Point | Immediate Support (S1) | Major Support (S2) | Immediate Resistance (R1) | Major Resistance (R2) |
|---|---|---|---|---|---|
| Nifty 50 | 24,205 | 24,140 | 23,980 | 24,290 | 24,380 |
| Bank Nifty | 52,280 | 51,950 | 51,600 | 52,550 | 52,900 |
| Nifty Financial | 23,480 | 23,320 | 23,150 | 23,620 | 23,800 |
📌 The Bottom Line
- nifty50: The NSE Nifty 50 dropped 50.80 points (-0.21%) to settle at 24,187.70, respecting the 20-day EMA support at 24,140 while consolidating below its 24,420 all-time high.
- sensex: The BSE Sensex slipped 238.41 points (-0.31%) to close at 77,470.11, heavily weighted down by banking heavyweights HDFC Bank and ICICI Bank.
- indian-stock-market: Market breadth remained robust across broader indices, with the Nifty Midcap 100 gaining +0.33% and Smallcap 100 rising +0.48%, led by strong gains in Nifty Realty (+1.42%) and Nifty Auto (+0.85%).
- fii-dii: Institutional flows displayed sharp divergence as FIIs aggressively bought +₹1,650.16 crore in cash equities, while DIIs locked in gains with net sales of -₹656.88 crore ahead of key corporate earnings.
📬 Stay Updated
Get daily technical analysis, FII/DII flow breakdowns, and sector rotation strategies delivered directly to your inbox before the market opens. Subscribe to our free Indian markets newsletter →
Disclaimer: The information provided in this post is for educational and informational purposes only and does not constitute financial, investment, or trading advice. Always consult a SEBI-registered financial advisor before executing trades or making investment decisions.
Enjoyed this post?
Get our weekly digest delivered free.
Share this post:
Knowelth is reader-supported. We may earn a commission from links in this article at no extra cost to you. Read our disclosure.
Related Posts

ITC Limited Demerger Analysis: Hotel Business Value Unlocking, FMCG Operating Leverage, and Cash Flow Yield
ITC Limited Demerger Analysis: Hotel Business Value Unlocking, FMCG Operating Leverage, and Cash Flow Yield ITC Limited, one of India’s foremost multi-business conglomerates operating across consumer …
Bharti Airtel Equity Analysis: 5G Network Monetization, ARPU Scaling Past ₹230, and Nxtra AI Data Center Expansion
Bharti Airtel Equity Analysis: 5G Network Monetization, ARPU Scaling Past ₹230, and Nxtra AI Data Center Expansion Bharti Airtel Limited, one of the world's leading telecommunications and digital comm…

SIP vs Lump-Sum: The 20-Year Mathematical Truth for Indian Investors
SIP vs Lump-Sum: The 20-Year Mathematical Truth for Indian Investors Every market cycle in India sparks the exact same debate among retail investors, mutual fund distributors, chartered accountants, a…