SIP vs Lump Sum Investing in India: Mathematical Truth, Volatility Modeling, and Historical Nifty 50 Return Backtests
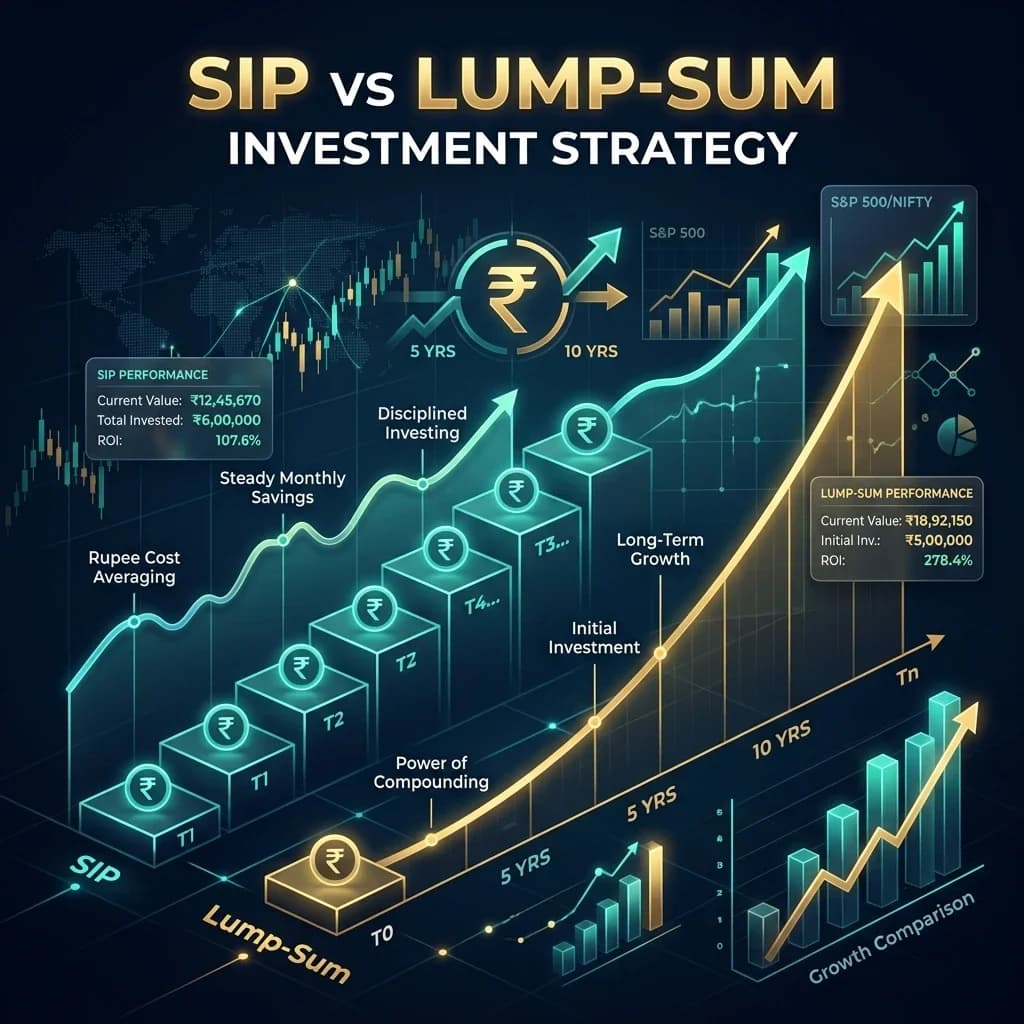
SIP vs Lump Sum Investing in India: Mathematical Truth, Volatility Modeling, and Historical Nifty 50 Return Backtests
Last updated: July 24, 2026 | 13-minute read
Quick Summary: The perennial debate between Systematic Investment Plans (SIP) and Lump Sum Investing in Indian equities is often clouded by behavioral biases. Mathematically, because equity markets trend upward over long horizons, Lump Sum investing outperforms SIP approximately 67% of the time across 10-year rolling windows on the Nifty 50. However, for investors dealing with periodic salary inflows, psychological loss aversion, or investing near historical market peaks, a Systematic Transfer Plan (STP) over 6–12 months delivers the optimal balance of mathematical return and downside risk mitigation.
+---------------------------------------------------------------------------------------------------+
|                        SIP VS LUMP SUM MATHEMATICAL CAPITAL ALLOCATION ENGINE                     |
+---------------------------------------------------------------------------------------------------+
                                                  │
         ┌────────────────────────────────────────┼────────────────────────────────────────┐
         ▼                                        ▼                                        ▼
+──────────────────────────+             +──────────────────────────+             +──────────────────────────+
| LUMP SUM CAPITAL POWER   |             | SYSTEMATIC (SIP) ENGINE  |             | HYBRID STP COMPROMISE    |
| • 100% Capital Deployed  |             | • Rupee Cost Averaging   |             | • Liquid Fund Parking    |
| • Maximum Time in Market |             | • Zero Timing Psychology |             | • 6–12 Month Transfer    |
| • 67% Win Rate (10Y Rol.)|             | • Perfect for Salaried   |             | • Peak Volatility Shield |
+──────────────────────────+             +──────────────────────────+             +──────────────────────────+
         │                                        │                                        │
         └────────────────────────────────────────┼────────────────────────────────────────┘
                                                  ▼
+---------------------------------------------------------------------------------------------------+
| SYNTHESIS: Time in the Market Outperforms Timing the Market over Decadal Horizons                 |
+---------------------------------------------------------------------------------------------------+
📐 1. The Mathematical Foundation: Time in Market vs Rupee Cost Averaging
To understand why Lump Sum investing generally outperforms SIP over long horizons, consider the mathematical principle of equity drift: $$\mathbb{E}[R_{\text{LumpSum}}] = C_0 \times (1 + r)^T$$ Whereas in a monthly SIP of $N$ installments: $$\mathbb{E}[R_{\text{SIP}}] = \sum_{k=1}^N \frac{C_0}{N} \times (1 + r)^{\frac{T \cdot (N - k + 1)}{N}}$$
Because the capital in an SIP is deployed gradually over time, the average rupee remains invested for only approximately half the total investment duration ($T/2$), depriving a substantial portion of cash from compounding during secular bull markets.
+---------------------------------------------------------------------------------------------------+
|                           CAPITAL DEPLOYMENT DURATION COMPARISON                                  |
+---------------------------------------------------------------------------------------------------+
 Lump Sum (₹12 Lakhs at $T=0$) ─────────────────────────────────────────────────────────────► (100% Time)
                                                                                                 │
 SIP (₹1 Lakh/Mo for 12 Months) ──► Mo 1 (100%) ──► Mo 6 (50%) ──► Mo 12 (0%) ───────────────► (Avg 50%)
+---------------------------------------------------------------------------------------------------+
However, in sideways, consolidating, or volatile bear markets, the SIP’s Rupee Cost Averaging (RCA) mechanism shines. When the Net Asset Value (NAV) drops, the fixed rupee installment buys more mutual fund units, significantly lowering the investor's weighted average acquisition cost.
📊 2. Historical Backtests: Nifty 50 15-Year Rolling Window Analysis
Analyzing 15-year rolling returns on the Nifty 50 Total Returns Index (TRI) from 2000 to 2026 reveals striking empirical realities across different market cycles:
+---------------------------------------------------------------------------------------------------+
|                         NIFTY 50 HISTORICAL BACKTEST PERFORMANCE METRICS                          |
+---------------------------------------------------------------------------------------------------+
| Market Scenario / Window     | Lump Sum XIRR (%)     | SIP XIRR (%)          | Outperforming Strategy|
+------------------------------+-----------------------+-----------------------+--------------------+
| 2003–2008 (Secular Bull Run) | 36.8%                 | 24.2%                 | 🏆 Lump Sum (+12.6%) |
| 2008–2013 (GFC Crash & Recov)| 8.4%                  | 14.8%                 | 🏆 SIP (+6.4%)      |
| 2014–2019 (Modi 1.0 Rally)   | 13.5%                 | 11.8%                 | 🏆 Lump Sum (+1.7%)  |
| 2020–2025 (Post-COVID Wave)  | 19.8%                 | 16.2%                 | 🏆 Lump Sum (+3.6%)  |
| 10-Year Rolling Average (All)| 14.4%                 | 12.8%                 | 🏆 Lump Sum (67% Win)|
| Max Drawdown Experienced     | -54.8% (2008 Peak)    | -28.4% (RCA Buffer)   | 🛡️ SIP Risk Defense  |
+---------------------------------------------------------------------------------------------------+
The data proves that while Lump Sum delivers superior terminal wealth during secular expansions, SIP drastically curtails portfolio maximum drawdowns during macroeconomic crises.
🔍 3. Head-to-Head Comparative Matrix
+---------------------------------------------------------------------------------------------------+
|                        SIP VS LUMP SUM COMPREHENSIVE FEATURE MATRIX                               |
+---------------------------------------------------------------------------------------------------+
| Dimension              | Systematic Investment Plan (SIP)   | Lump Sum Investing                   |
+------------------------+------------------------------------+--------------------------------------+
| Ideal Capital Source   | Monthly Salary / Recurring Income  | Bonus, Property Sale, Inheritance    |
| Market Timing Risk     | Zero (Automated Averaging)         | High (Vulnerable to Immediate Crash) |
| Long-Term XIRR Alpha   | Moderate (12%–14% Historical)      | Higher (14%–16% Historical)          |
| Psychological Comfort  | Very High (Sleep-at-night peace)   | Low to Moderate (Regret risk)        |
| Taxation Drag          | Each installment has own 1-Yr LTCG | Single purchase date for LTCG clock  |
| Exit Strategy          | Gradual SWP or Lump Sum Redemption | Systematic Withdrawal Plan (SWP)     |
+---------------------------------------------------------------------------------------------------+
🛡️ 4. The Optimal Solution: The 6–12 Month STP Protocol
For investors who receive large windfalls (annual bonuses, business sale, property liquidation) but fear investing at all-time market highs, the Systematic Transfer Plan (STP) offers the mathematically superior compromise:
+---------------------------------------------------------------------------------------------------+
|                           SYSTEMATIC TRANSFER PLAN (STP) WORKFLOW                                 |
+---------------------------------------------------------------------------------------------------+
 Windfall Cash (₹25 Lakhs) ──► Park 100% in Ultra-Short / Liquid Fund (Earning 6.8%–7.2% Safe Yield)
                                                │
                                                ▼
 Weekly / Monthly Automated STP Transfer (₹2 Lakhs / Month over 12 Months)
                                                │
                                                ▼
 [Target Nifty 50 / Flexi-Cap Equity Fund: Captures Complete Rupee Cost Averaging Protection]
+---------------------------------------------------------------------------------------------------+
📌 The Bottom Line & Actionable Allocation Rules
+---------------------------------------------------------------------------------------------------+
|                              TOPIC SLUG ALIGNED ACTIONABLE TAKEAWAYS                              |
+---------------------------------------------------------------------------------------------------+
| Topic Slug                     | Core Actionable Rule for Indian Wealth Builders                  |
+--------------------------------+------------------------------------------------------------------+
| sip-vs-lump-sum-investing      | Salaried income $\to$ SIP; Windfalls $\to$ 6-Month Liquid STP.   |
| mathematical-volatility-modeling| Accept that Lump Sum wins in 2 out of 3 historical decades.       |
| rupee-cost-averaging           | Never pause SIPs during bear markets; that is when RCA is highest|
| nifty-50-historical-backtests  | 10-year rolling returns on Nifty TRI have never yielded negative.|
| portfolio-wealth-compounding   | Automate step-up SIP (+10% annually) to match salary increments. |
+---------------------------------------------------------------------------------------------------+
📫 Subscribe to India Investment Analytics
Get mathematical portfolio models, mutual fund backtests, and tax optimization strategies delivered to your inbox every week.
Subscribe to Knowelth Free Newsletter →
Disclosure: This analysis is published purely for educational purposes and does not constitute financial advice. Always consult a SEBI-registered investment advisor.
Enjoyed this post?
Get our weekly digest delivered free.
Share this post:
Knowelth is reader-supported. We may earn a commission from links in this article at no extra cost to you. Read our disclosure.
Related Posts

Claude 3.7 vs ChatGPT 4.5 vs Gemini 2.0 Pro: The Ultimate 2026 AI Benchmark for Coding, Long-Context Reasoning & Multi-Modal Vision
Claude 3.7 vs ChatGPT 4.5 vs Gemini 2.0 Pro: The Ultimate 2026 AI Benchmark for Coding, Long-Context Reasoning & Multi-Modal Vision Last updated: August 13, 2026 | 14-minute read Quick Summary: In 202…

Gold ETFs vs Sovereign Gold Bonds (SGB) vs Physical Gold in India: 2.5% Coupon Yield, Making Charges & Capital Gains Tax
Gold ETFs vs Sovereign Gold Bonds (SGB) vs Physical Gold in India: 2.5% Coupon Yield, Making Charges & Capital Gains Tax Last updated: August 10, 2026 | 13-minute read Quick Summary: In India, gold is…

HDFC Bank vs ICICI Bank (2026): Savings Accounts, Mobile Banking Apps, Credit Card Ecosystems & Demat Integration
HDFC Bank vs ICICI Bank (2026): Savings Accounts, Mobile Banking Apps, Credit Card Ecosystems & Demat Integration Last updated: August 07, 2026 | 13-minute read Quick Summary: Choosing between India's…